
 Eye Imaging – We invent light-based technologies to measure retina and optic nerve structure/function, as well as detect disease, in the living eye.
Deep Brain Microscopy – We explore new microscopic methods to look deeper into the living brain and see disease progression.
Brain Spectroscopy (iNIRS) – By adding interferometry (i), we enable near-infrared spectroscopy (NIRS) to better monitor brain health.
Read our publications.
Eye Imaging
Contrast-enhanced and dynamic contrast OCT of the retina and choroid
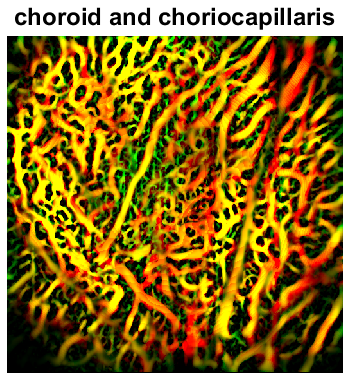 The tiny blood vessels that nourish the light-sensitive cells at the back of the retina have been notoriously difficult to study in vivo. While imaging with Optical Coherence Tomography (OCT) angiography, a widely used method, we inject a highly scattering contrast agent (which also happens to be FDA-approved for nutritional uses) to enhance the signal from these vessels. This enables the clear visualization of the all-important choriocapillaris microvasculature for the first time, even beneath an intact retinal pigment epithelium (left) in the rat.
We have also developed a new technique called Dynamic Contrast Optical Coherence Tomography (DyC-OCT), which allows us to quantify flow in regions, including the blood vessels near the back of the eye, that other methods cannot reach. This is valuable for studying the progression of eye diseases such as age-related macular degeneration. For more information, read our recent publication on the topic.
Spectroscopic imaging of the retina with visible light Optical Coherence Tomography
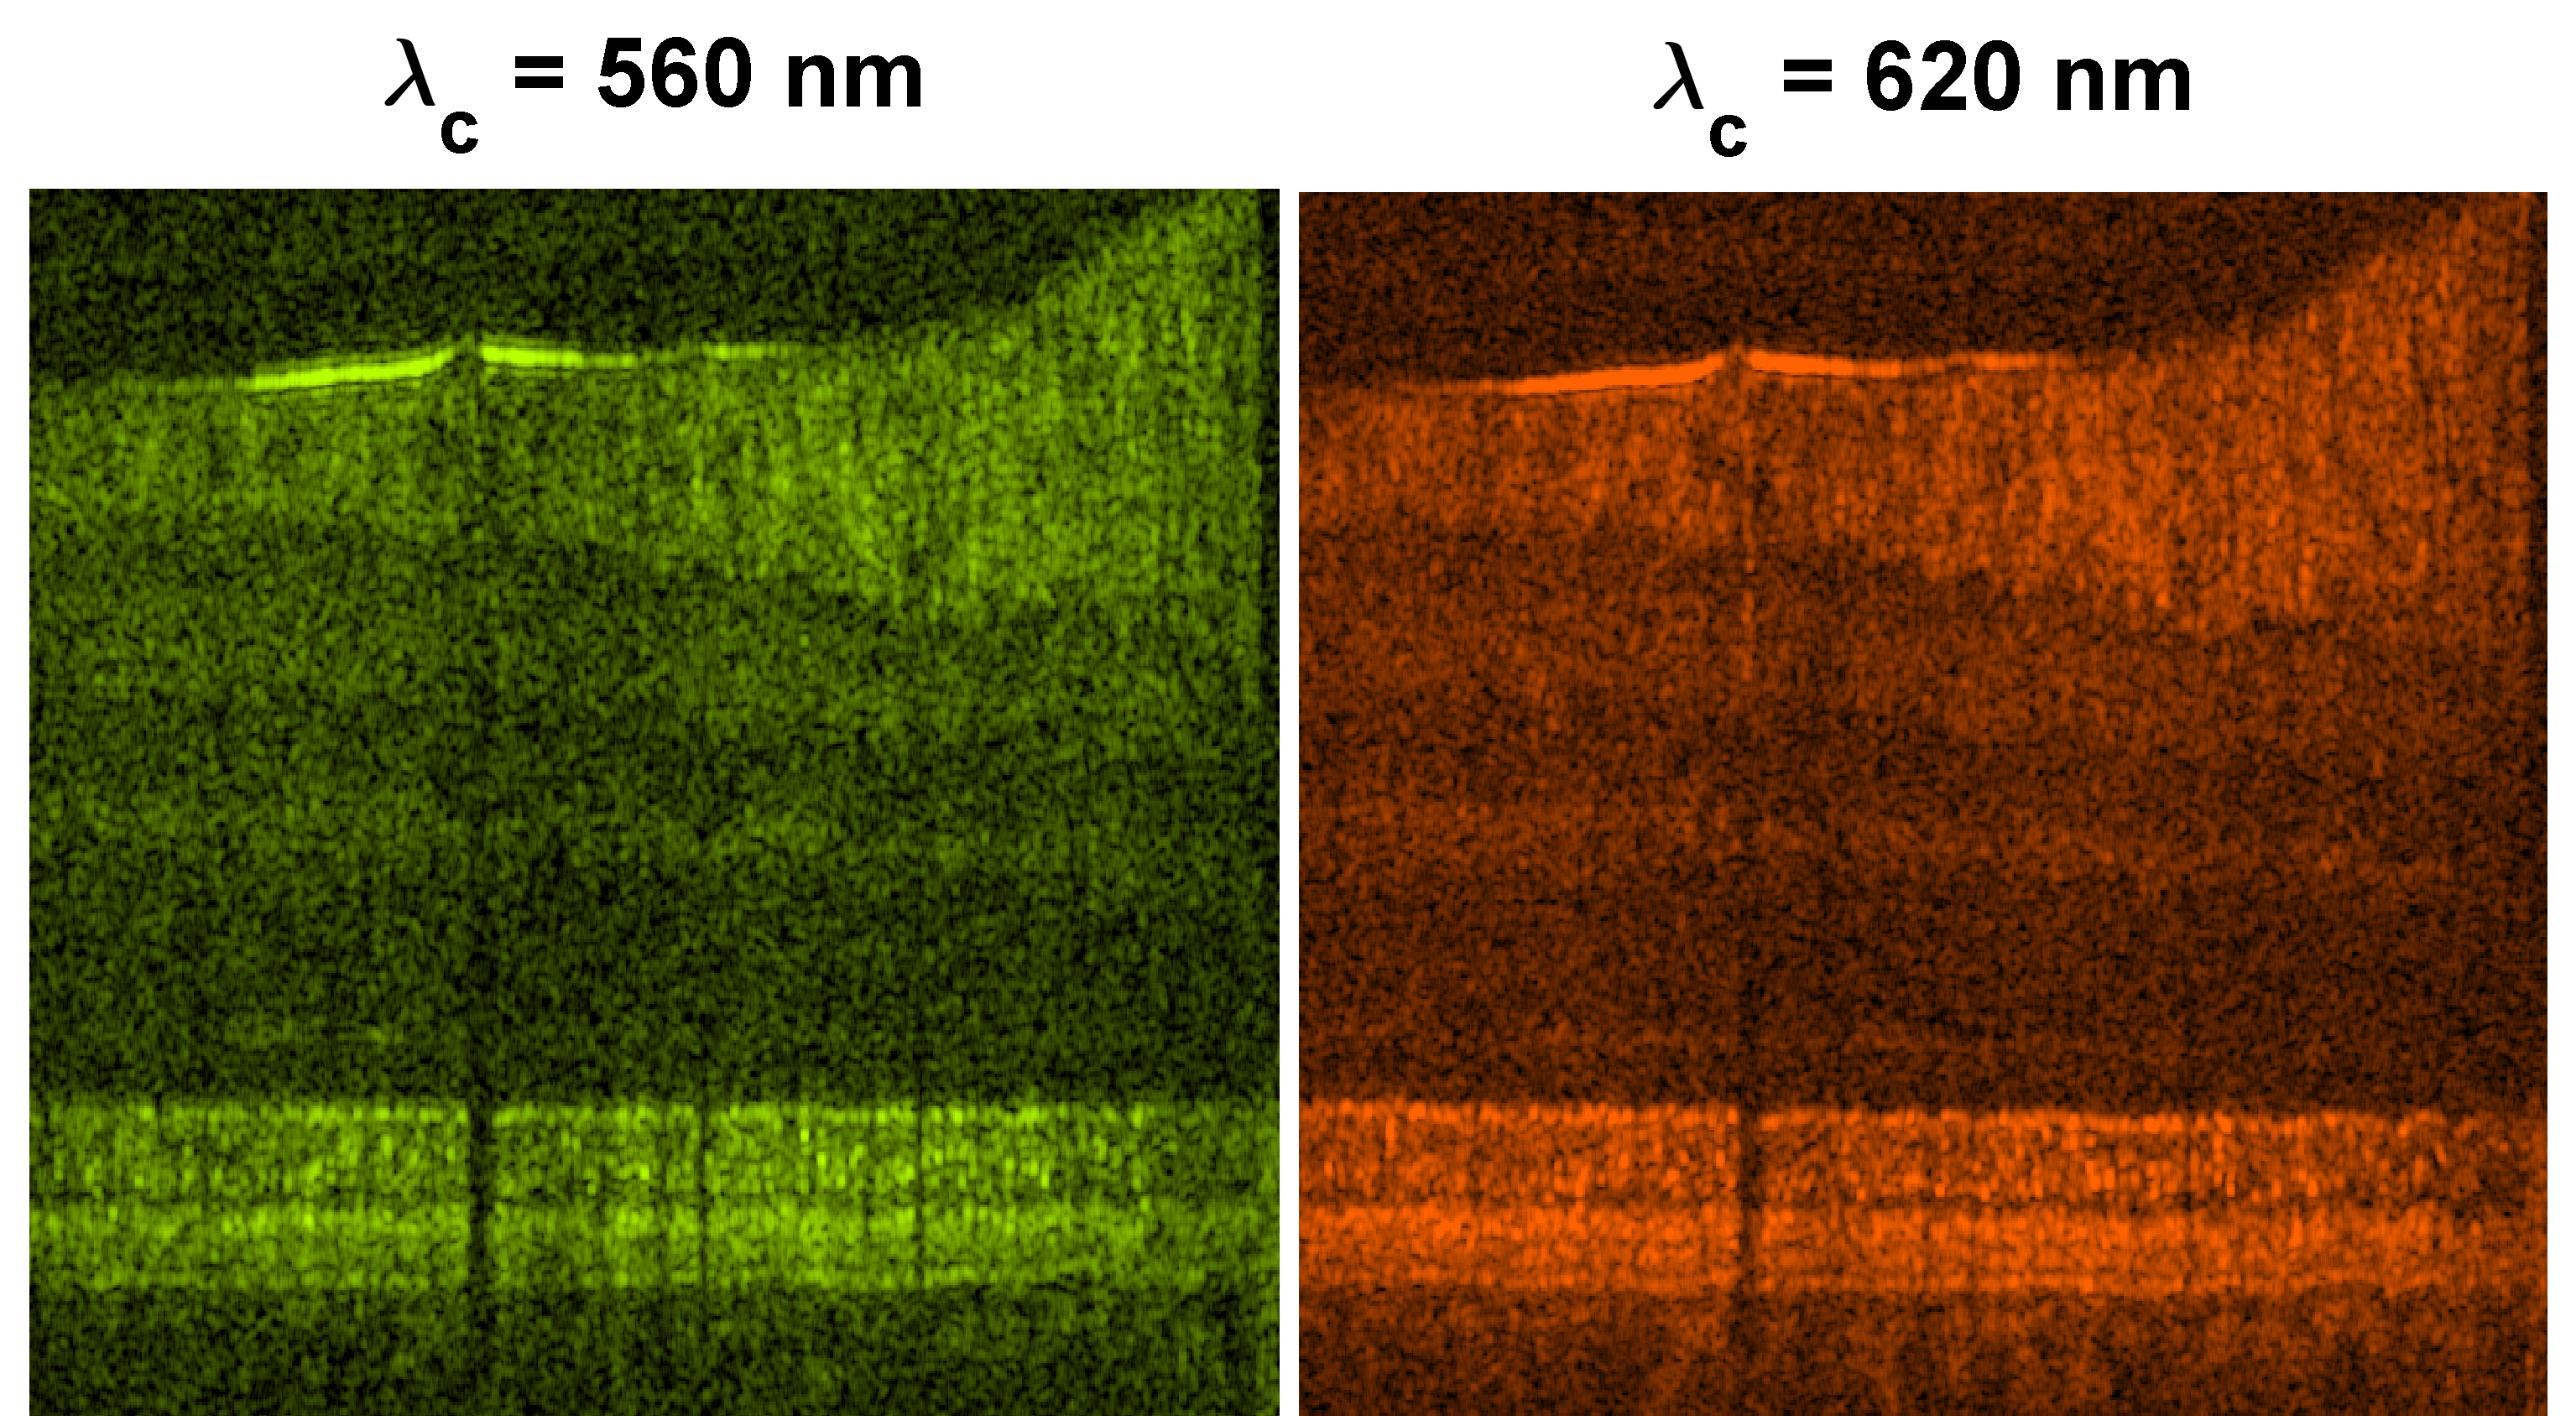 The absorption of visible photons by photopigment in the retina is the beginning of phototransduction that underlies visual perception, and numerous chromophores (absorbing molecules) in the retina or its blood supply absorb visible light. Yet, current clinical ophthalmic imaging diagnostics such as Optical Coherence Tomography often use near-infrared (NIR) light. While near-infrared light can delineate layers in the retina based on NIR light scattering, visible light offers new diagnostic approaches, such as measuring concentrations of important retinal chromophores or assessing light scattering from smaller structures, such as microtubules, which may be sensitive to early axonal changes in glaucoma. Preliminary human images are shown on the right. The innovation over current clinical OCT systems is improved axial resolution and new avenues to assess retinal function, as described here. Unique challenges in optical design, safety considerations, and the development of robust algorithms make this a significant research effort.
Deep Brain Microscopy
Intrinsic imaging of the brain in vivo and ex vivo
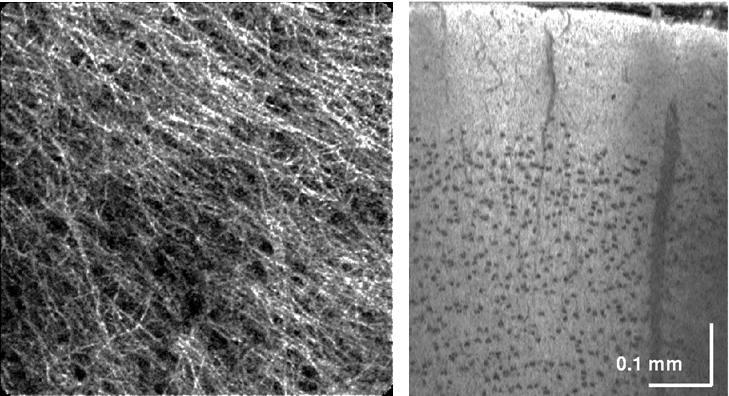 In fluorescence microscopy, a “contrast agent” is administered to enhance or highlight images of a cell type, tissue, or biological pathway of interest. Instead, we have developed an in vivo brain imaging strategy using only “intrinsic” contrast, or scattering contrast provided by the tissue itself. Myelinated axons are bright (high backscatter), while neuronal cell bodies are dark (low backscatter), relative to the neuropil background. In particular, we use Optical Coherence Microscopy (OCM) and dynamic focusing to perform intrinsic imaging of the live brain. Images of myelination from a living cerebellum (left image) and cell bodies in the cortex (right image), the latter imaged through a rat closed cranial window in vivo, show the power of the method. Direct visualization of cellular changes using OCM can also provide novel optical markers of cell viability. Further details can be found here.
 We have extended the above OCM method to work with clearing techniques to probe even deeper into tissues (~3 mm) with micron-scale resolution ex vivo. Chemical clearing techniques make the brain transparent so we can see deeper, but not too transparent, so we can still measure backscattering. Further details can be found in a published paper. A movie from this paper was chosen as the cover illustration (.gif format), as shown on the right. The movie shows a series of en face images as light is focused deeper and deeper into the cortical, and eventually, subcortical layers. Differences in myelin and cellular architecture are apparent.
Longer wavelengths for subcortical imaging
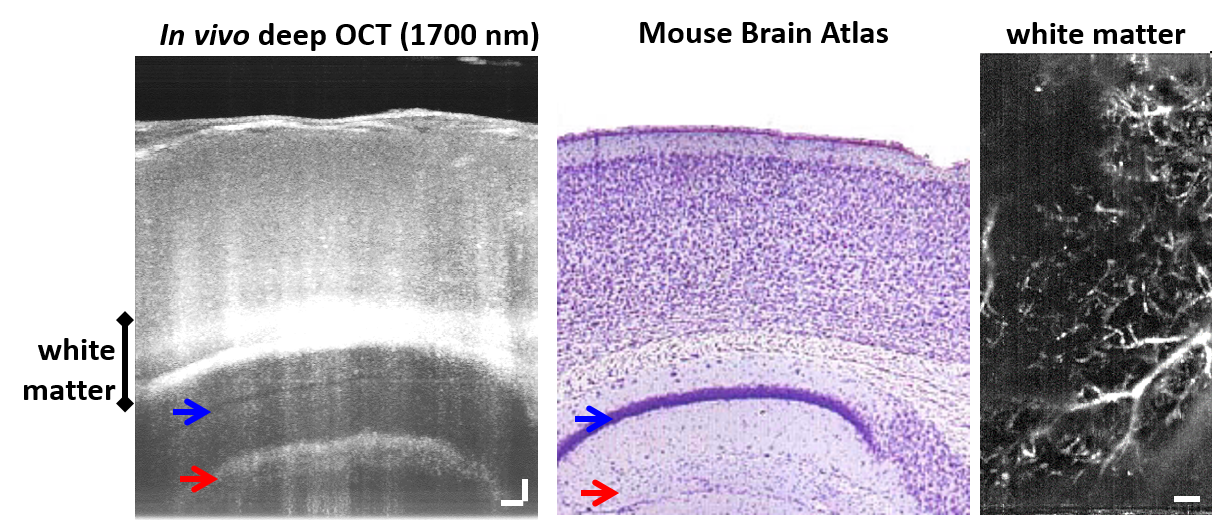 We are pushing to improve imaging depths in vivo, as well, by using longer wavelengths which are less scattered by biological tissues. In particular, we must probe deep cortical and sub-cortical brain regions to understand what happens in Alzheimer’s disease and vascular dementias. On the left, we show the capability to image white matter microvascular perfusion and subcortical structures with longer wavelength OCT, through the thinned skull in a mouse model.
Measuring blood flow
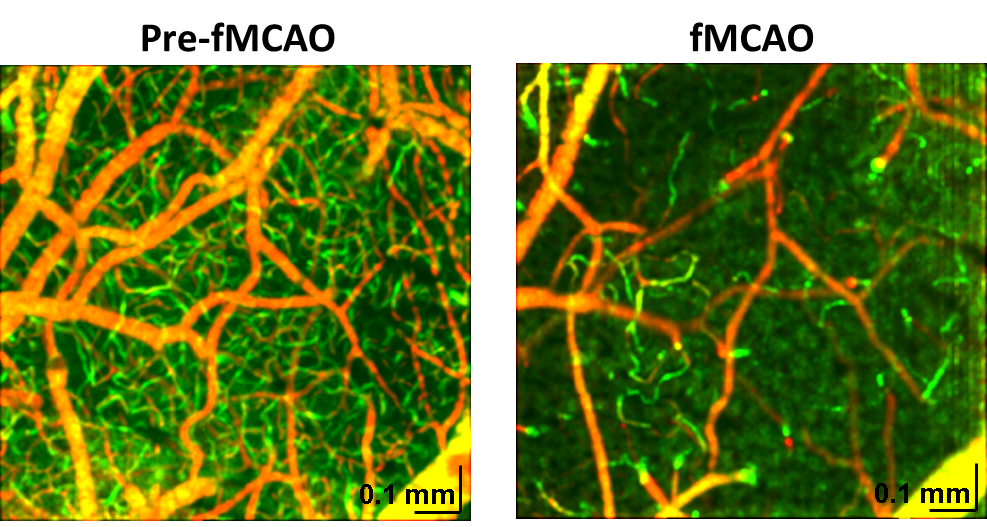 We are on a mission to improve the quantification of brain blood flow, from the macro- to micro- level, both of which have been historically challenging methodological problems. We have applied these imaging methods to study brain injury longitudinally, as described in our PLoS One publication here and our JCBFM publication here. These studies highlight the importance of perfusion distribution as an important determinant of tissue outcome, rather than blood flow per se. At right, we illustrate changes in perfusion at the capillary level before and after filament middle cerebral artery occlusion (fMCAO), which is a very basic model of a stroke.
Neurovascular coupling in the brain
Neurovascular coupling is the “talking” of neurons to blood vessels, telling them to dilate to increase blood supply and bring fresh oxygen and glucose to active brain regions. We have developed a method for multi-modal electrophysiology and OCT to measure neuronal activity and the hemodynamic response, the cause and effect of neurovascular coupling, respectively. We are currently developing advanced optical microscopy techniques for better understanding neurovascular coupling, which is the basis of many of the brain signals we can currently assess in humans. Click on the presentation on the left to see our recent work in the journal Neuroimage.
Brain Spectroscopy (interferometric Near-Infrared Spectroscopy: iNIRS)
What is iNIRS?
 Near-infrared light can penetrate deep into biological tissues, bouncing around (scattering) many times before it finally escapes or is absorbed. Our idea is to use interferometry to tell us more precisely what happens to light on this journey (i.e. how much time the light took to escape and how rapidly the light fluctuates). By doing this, we get more quantitative, and hence, diagnostically useful, measurements of biological tissue. We recently demonstrated the key benefits of this technique in phantoms and validated it in vivo in the rodent brain. Currently, efforts are underway to translate this novel and exciting tool for clinical use to better diagnose and monitor brain disorders.
How does iNIRS work?
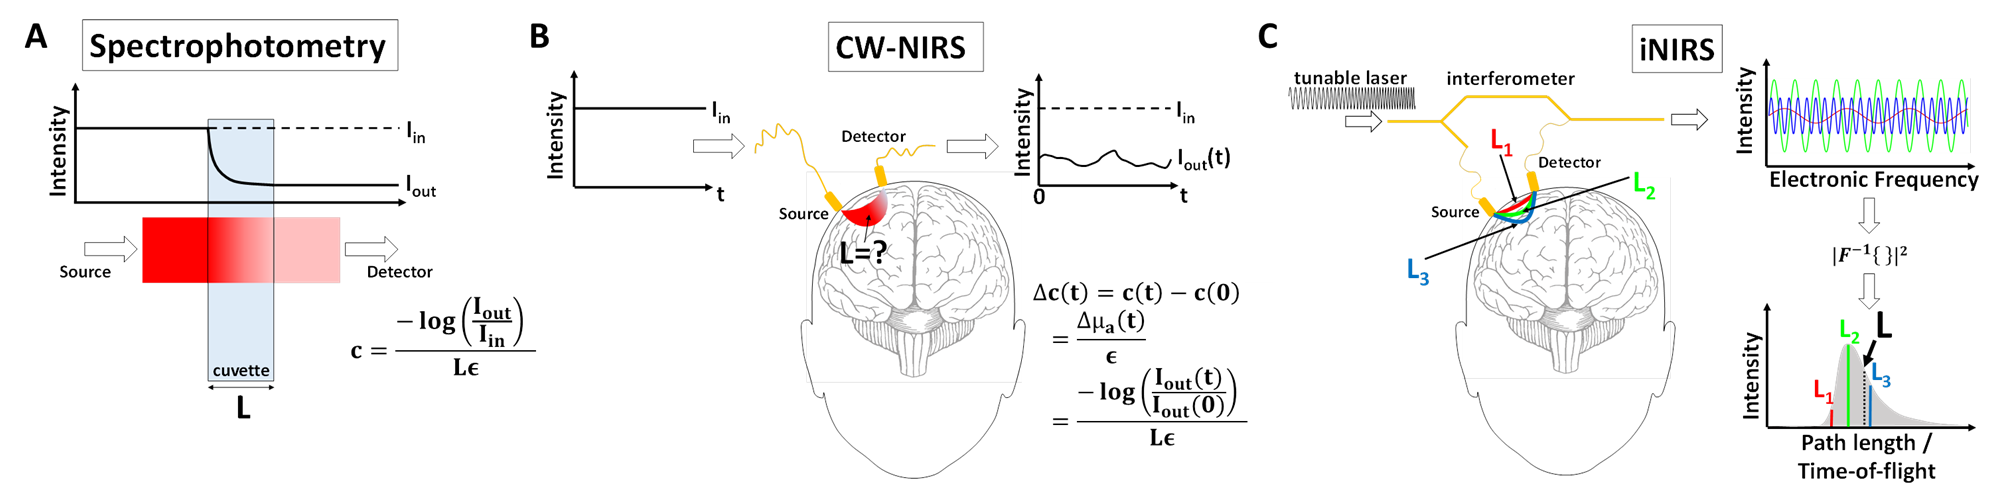 In chemistry, spectrophotometry (A) measures chromophore (absorbing molecule) concentration (c) in a cuvette of known length L and specific extinction coefficient ε by measuring input (Iin) and output (Iout) light levels. In Continuous Wave (CW-) NIRS (B), the mean path length (L) that light can take through the brain is unknown due to scattering, and Iin is difficult to calibrate. While absolute measures of concentration (c) are challenging, concentration changes (Δc(t)) can be estimated from relative changes in intensity, Iout(t)/Iout(0), if L is known or assumed. Interferometric Near-Infrared Spectroscopy (iNIRS) solves these problems by directly resolving the light path length or time-of-flight (C), and quantifying optical properties. Thus, like a spectrophotometer, iNIRS can measure chromophores, but in highly scattering biological tissues! Read more about the iNIRS method here.